
This time we are going to talk about IDE build analyzers.
What is a build analyzer? I’m sure many of you are wondering.
What do you do when you have written a lot of programs, or when you are worried about RAM usage?
There is a way to check by looking at a map file (with a .map extension), but when you open the text file in an editor and check it, your eyes will flicker and it will be hard to check. This is where the Build Analyzer comes in.
The Build Analyzer is an easy way to check the memory usage.
To use the Build Analyzer, set it to Run – Debug.
In that state, select Window – Show View – Build Analyzer.
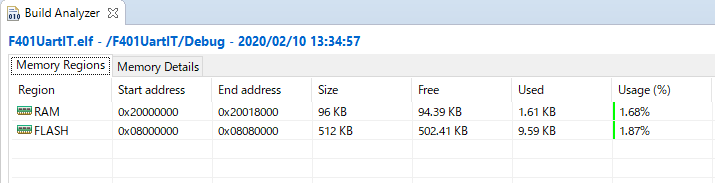
Memory Regions tab
You can see the RAM usage and FLASH (ROM) usage at a glance.
Memory Details Tab
You can check the details of your usage.
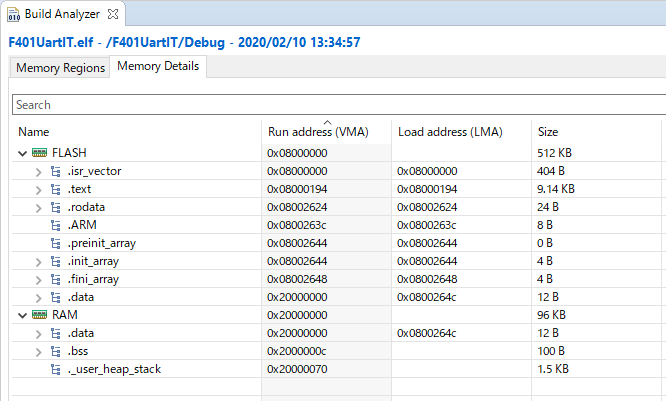
The main areas are organized as follows
FLASH:
.isr_vector
Area for interrupt vectors
.tet
Program (code) area
.rodata
Area of const constants and string literals
.data
An area that stores the initial values of variables that require initial values
=====
RAM:
.data
Area for variables that require initial values
.bss
Area for variables that do not require initial values (initialized to zero)
. _user_heap_stack
Stack area
I don’t want to develop while worrying about memory space, but if it gets too much, this is a good place to start.


