
In this article, I will write about debugging using printf().
The following is the development environment at the time of posting.
PC: Windows 10 OS
IDE: STM32CubeIDE Version1.3.0
Configurator: STM32CubeMX Version5.5.0
Board: STM32Nucleo-F401RE
Overview
Sometimes you want to check the result of a process every time you do something.
This is where printf() comes into play.
The UART serial output method is also often used, but it is a bit time-consuming.
In this article, we will show you how to check the output of printf() in the IDE.
Create a project
Start the IDE, select File- New – STM32 Project, when the Target Selection window comes up, select the Board Selector tab, select NUCLEO-F401RE from the Boards List and press the Next button.
Enter F401DebugPrintf as the Project name and press the Finish button.
When it asks “Initialize all peripherals with their default Mode ? Press Yes.
This kind of project is associated with the STM32CubeMx perspective. Do you want to open this perspective now ? Press Yes.
Coding
In order to use printf(), we use _write().
_write() is written in syscall.c as follows.
__attribute__((weak)) int _write(int file, char *ptr, int len)
{
	int DataIdx;

	for (DataIdx = 0; DataIdx < len; DataIdx++)
	{
		__io_putchar(*ptr++);
	}
	return len;
}
It turns out that the entity of the output is __io_putchar().
__io_putchar() is also written in syscall.c as follows.
Since it also has a weak attribute, we can leave this part as it is and overwrite the function somewhere else.
extern int __io_putchar(int ch) __attribute__((weak));
Write the following code in main.c before main().
/* USER CODE BEGIN 0 */.
#include <stdio.h>
int __io_putchar(uint8_t ch)
{
	return ITM_SendChar(ch);
}
The instrumentation trace macrocell (ITM) allows the retrieval of debug information in printf format for diagnostic purposes.
The ITM enables the retrieval of debug information in printf format for diagnostic purposes.
To output to the debugger, use ITM_SendChar().
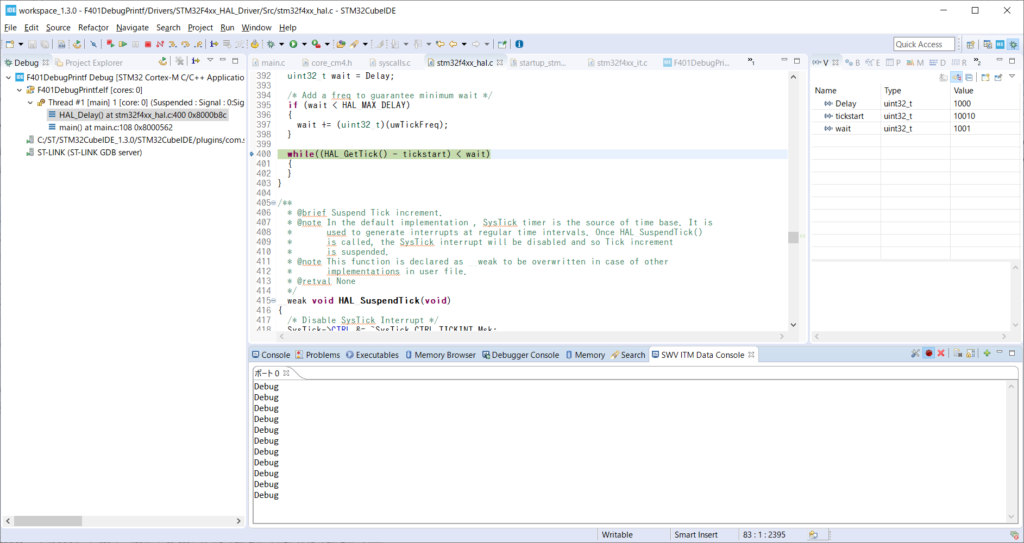
And implement printf() in the while() loop.
/* USER CODE BEGIN WHILE */
  while (1)
  {
	  printf("Debug\r\n");
	  HAL_Delay(1000);
    /* USER CODE END WHILE */ /* USER CODE BEGIN 3
    /* USER CODE BEGIN 3 */ }
  }
  /* USER CODE END 3 */ }
Configure the debugger side
Select the Debugger tab in Run - Debug Configurations and check the Enable Serial Wire Viewer (SWV) checkbox.
In the Clock Settings, set the Core Clock to an appropriate value.
For this board, I set it to 84.0 MHz.
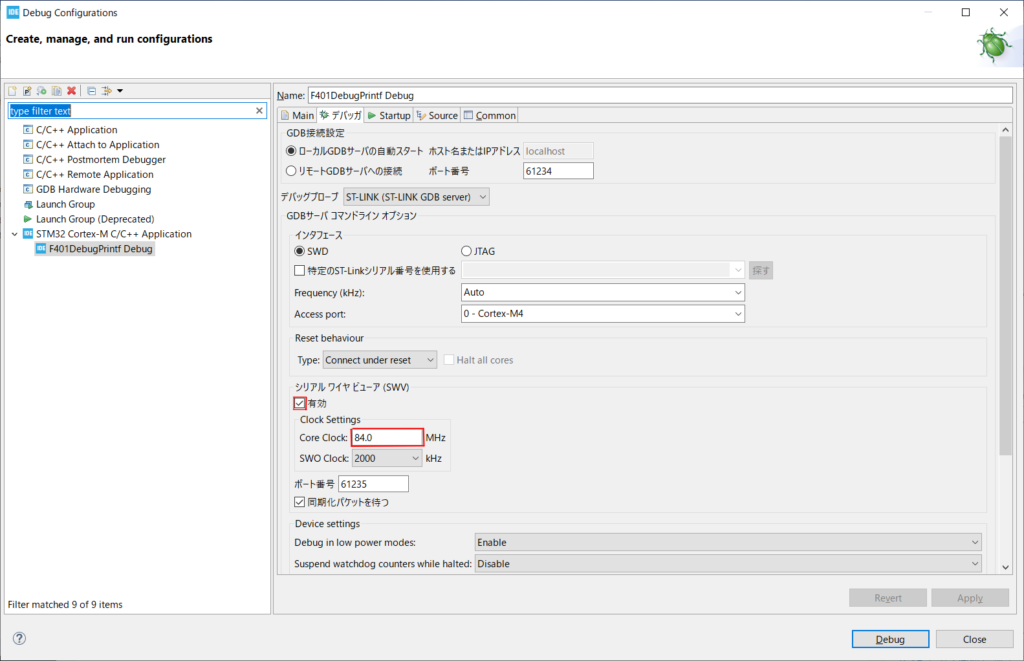
After configuring the settings, click the Debug button.
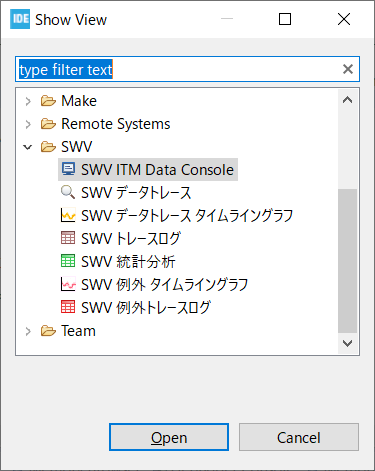
Next, select Window - Show View - Other, and when the small window appears, select SWV ITM Data Console and Open it.
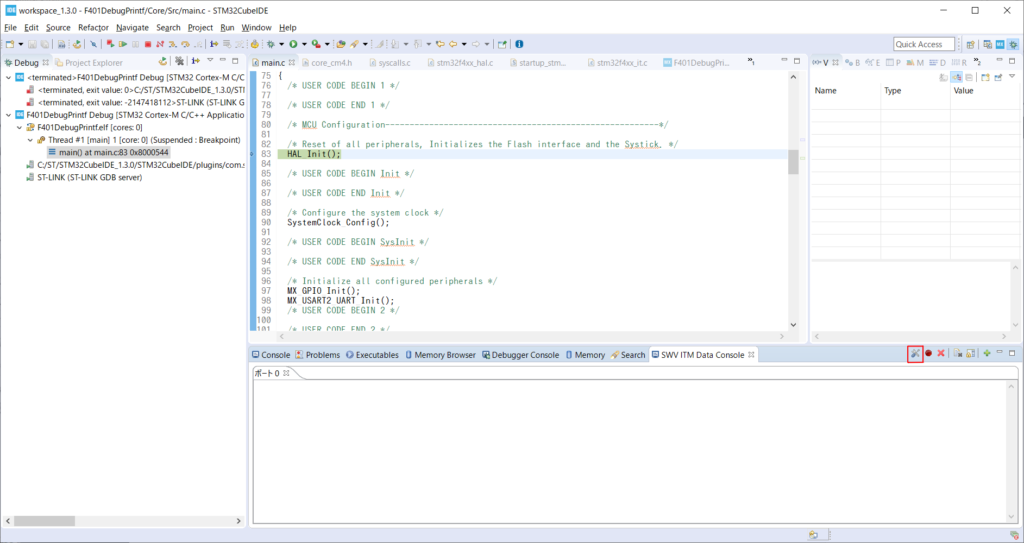
Click on the left (red frame) of the icons on the right side.
Check only the rightmost checkbox of the ITM Sutimulus port.
If any other checkboxes are checked, uncheck them all.
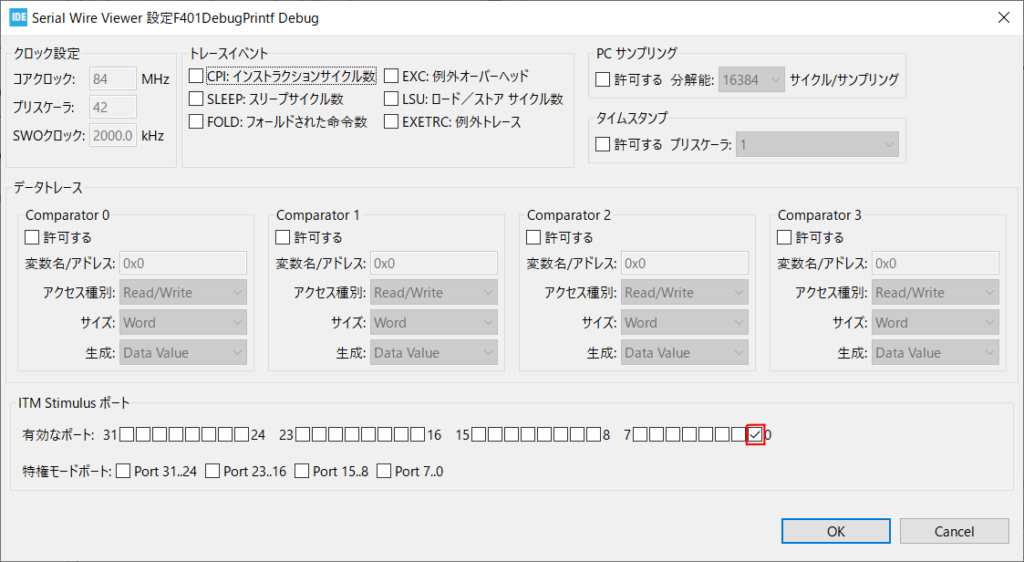
Then press OK to close the window.
Before we start debugging, we will make one last setting.
Click on the second zeros from the left of the icons that line the right side of the SWV ITM Data Console.
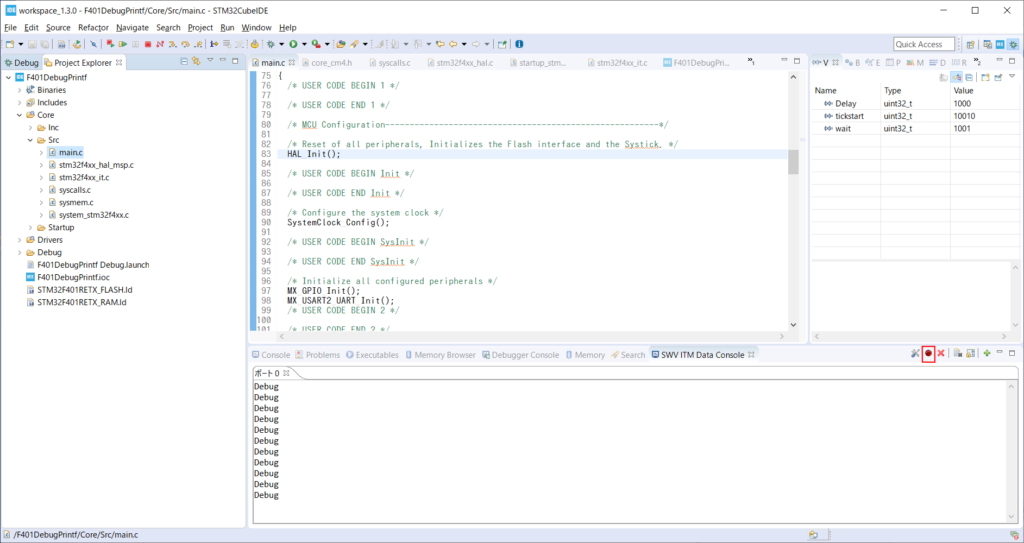
This is very confusing, but when you click on it, the button with the zeros looks like it is indented.
![]()
You are now ready to printf() debug.
Now run the program by pressing Run - Resume.
If you see the word Debug every second, you have succeeded.
It took a bit of work, but once it's set up, it's good to go, and it's easier than checking with the UART.
This is a great way to debug.


